
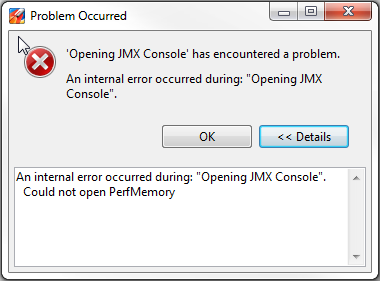
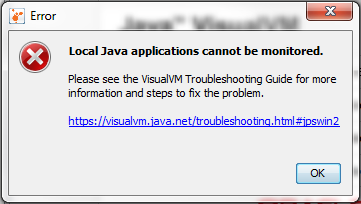
Today I encountered a strange error opening both Java Mission Control and VisualVM: “Could not open PerfMemory” and “Local Java applications cannot be monitored”:
After searching and testing for quite a while, I read the solution at the VisualVM troubleshooting guide:
Local Applications Cannot Be Monitored (Error Dialog On Startup)
Description: An error dialog saying that local applications cannot be monitored is shown immediately after VisualVM
startup. Locally running Java applications are displayed as
Resolution: This can happen on Windows systems if the username contains capitalized letters. In this case, username is UserName but the jvmstat directory created by JDK is %TMP%\hsperfdata_username. To workaround the problem, exit all Java applications, delete the %TMP%\hsperfdata_username directory and create new %TMP%\hsperfdata_UserName directory.
That’s it for this post. Hope I helped someone searching a little less for a solution for this little bugger. :)